By +James Sayer
As a Math teacher and working with learning technologies I am a total data geek and always looking for ways to harness the data we collect in schools. Having previously worked with Fusion Tables – an analysis app able to pull data in and geotag it and produce complex heatmaps very easily – I was excited to get going with Data Studio.
Charts in Sheets have been super powered by the Explore AI to extend their functionality. But what if we could pull in data from multiple sources and compare and analyse it side by side? Thats where Data Studio comes in. Launched in 2017, Data Studio has been designed with the internet marketer in mind (it has multiple connections to website data). However, with the Google Sheets connection, anything schools record in forms or sheets can now be pulled into Data Studio. But what exactly is Data Studio?
Data Studio is a set of advanced numerical and visualisation tools to help comprehend large complex data sets….yikes!
Data Studio creates easy to read reports and charts from a number of different data sources. Here is a sample Data Studio dashboard summarising #GooglePD tweets in the last 30 days:
 |
| Click to view live chart |
We can see here a clean, simple overview of tweets that dynamically updates based upon current activity and shows the latest tweet!
For my school I have created dashboards comparing technology adoptions, behaviour patterns and learning indicators. Unlocking this data for other teachers to view, act and collaborate on. Of course a number of SIS allow this analysis, but GSuite and Data Studio are more powerful in that you can customise the indicators you are collecting and compare across any you choose.
Ok, lets get started!
Head over to datastudio.google.com for the Data Studio homepage, and the first thing you should do is check out the ‘Getting Started’ tutorial on the homepage. This will walk you through the basic steps of creating a visualization. Secondly check out these video tutorials.
Ok now you are ready to get started with your own dashboard.
Scenario: Build a simple Student data dashboard combining multiple data sources (GPA, absences, tardiness)
For demonstration purposes, the data is contained within three tabs of a Spreadsheet, however Data Studio can access multiple data sources from multiple Sheets files.
1. Go ahead and make a copy of this sample data sheet
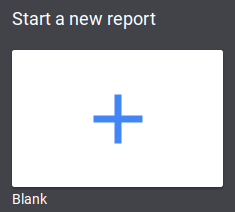
2. Go to datastudio.google.com and click ‘Start a New Report’
3. We now need to tell Data Studio where to look for data. Click the ‘Create New Data Source’ blue button.
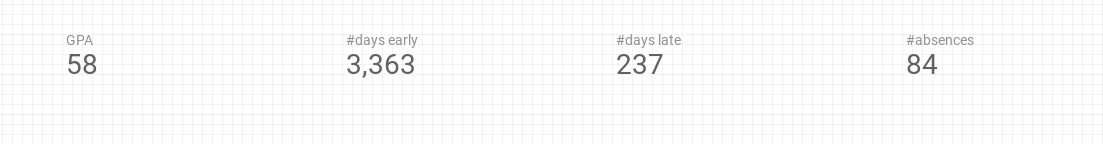
11. But wait, this is showing the sum of each across all students! Not what we need….so we need to include a filter in order that we can select one student at a time.
 ), change the ‘Dimension’ of this control to ‘Student’.
 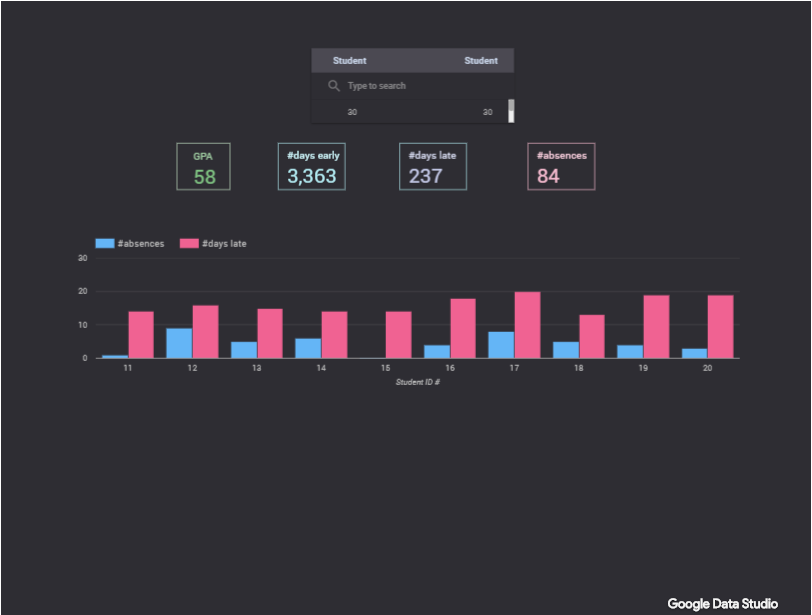 |
| Click to view live chart |
In closing, Data Studio can produce some really great visuals which can help educators unlock insights into the data we are collecting. There are many great SIS out there collecting data, but with the powerful customisation of Forms and Sheets, Data Studio gives educators the tools to begin analysing their own data in truly complex ways. This sample dashboard didn’t use any great visuals, but there are many charts that can display summary data and combined data sources.
If you begin doing something cool with Data Studio please do comment below! Here are some more ideas:
- Technology status dashboard
- Summary discipline (or positive behaviours) report
- Parent attitudes to learning in school
- Grade reports
For those curious to learn more and want in-person training on what else you can do in Data Studio, come join us at our Qatar Summit happening this April where James will do a session. Note that we offer 10% discount for schools booking 5 or more attendees for the summit. So make sure to share the good news and then register as a group! http://qatar.appsevents.com/

2 Responses
Hi! We have been using Datastudio at our school (in India) during the entire school from home period for the last 6 months to track school wide attendance, engagement and learning. We are learning along the way and so we are probably designing our reports very inefficiently, but irrespective it has been a huge value add and I fully agree that Datastudio is a tool schools have not leveraged enough yet! I have been looking to connect with other educators to learn how different schools are using it. If you are open do this I would like to get in touch! Also if you know of any Educator Data Studio communities, please do share!
Thanks for your comment