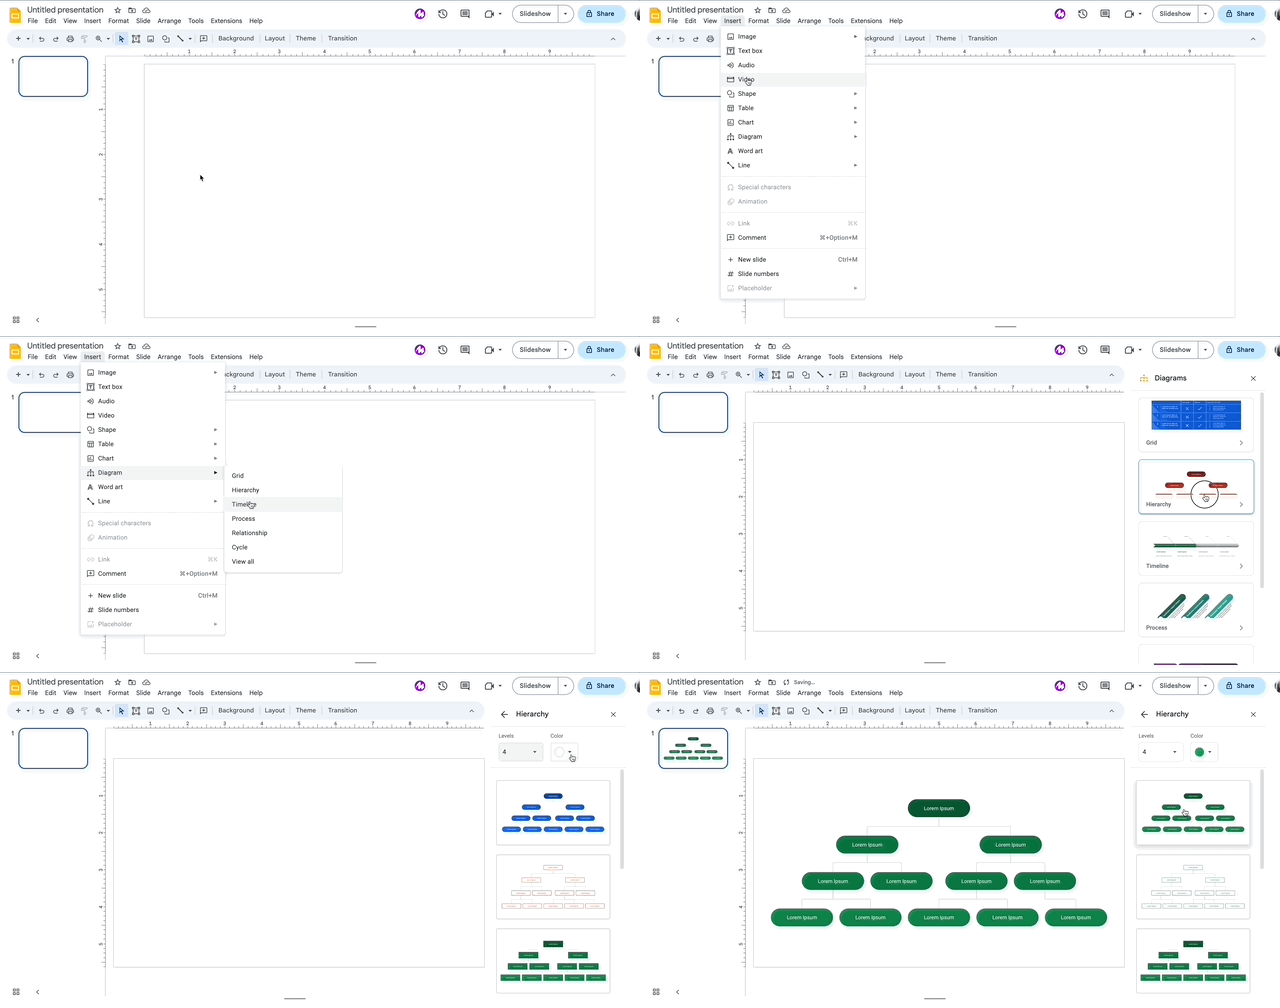
Google Slides is an incredibly multi-faceted tool with options that can enhance student learning. One of these features is the diagram feature, which allows users to add a wide variety of diagrams to their presentations. Let’s take a look at some fun, interactive, and of course, educational uses for the diagram feature in Google Slides.
Visualize complex concepts
Diagrams can be a powerful tool for visualizing complex concepts. Teachers can use diagrams to help students understand difficult concepts such as scientific processes or mathematical formulas. For example, a science teacher could use a diagram to help students understand the process of photosynthesis.
Enhance student engagement
Diagrams can make learning more engaging and interactive. Teachers can use diagrams to create interactive activities for students such as labeling and identifying parts of a diagram. For example, a social studies teacher could use a map diagram to help students learn about the different states in a country.
Improve retention of information
Using diagrams can improve retention of information. Studies have shown that visual aids can help students retain information better than text alone. For example, an English teacher could use a Venn diagram to help students compare and contrast two characters from a book.
Encourage creativity
Using diagrams can encourage students to be more creative. Teachers can encourage students to create their own diagrams to represent a concept or process. For example, a music teacher could ask students to create a diagram to represent the structure of a song.
Promote collaboration
Diagrams can be used to promote collaboration among students. Teachers can create group activities that require students to work together to create a diagram. For example, a math teacher could ask students to work together to create a diagram to represent a geometric concept.
How to Use
To use the diagram tool, simply click on the “Insert” tab and then select “Diagram.” A menu of different diagram types will appear. Select the type of diagram you want to create and then click on it. A new slide will be created with the diagram already inserted.
You can then edit the diagram to your liking. To add text to a diagram, simply click on the text box and start typing. To add shapes to a diagram, click on the shape you want to add and then drag it onto the diagram. You can also resize and reposition shapes and text boxes as needed.
When you’re finished editing the diagram, click on the “Done” button. The diagram will be inserted into your presentation.

Here are a few tips for using the diagram tool in Google Slides:
- Labels should be clear and concise so that viewers can easily understand the diagram.
- Use colors and shapes to differentiate between different parts of the diagram to aid connections and relationships between elements.
- It is important to keep the diagram simple so that viewers can easily understand it.
- Use diagrams to supplement your presentation, not to replace it. Diagrams can be a helpful way to illustrate concepts, but they should not be the only way that you present information.
The diagram feature in Google Slides can be a powerful tool for enhancing the educational experience. It can be used to visualize complex concepts, enhance student engagement, improve retention of information, encourage creativity, and promote collaboration among students. So the next time you’re creating a presentation or activity, consider giving it a try!


